After receiving control and determining the response rates, followed by data entry, data analysis and reporting is an important sub-process that produces decision-relevant results from the employee survey for the first time.
(1) Automated and semi-automated data evaluation
The evaluation of the entered data is carried out by different tools and software solutions, which ISPA consult GmbH provides and applies for the situation specific for the customer.
(2) Choice between different report forms
We offer different reporting forms:
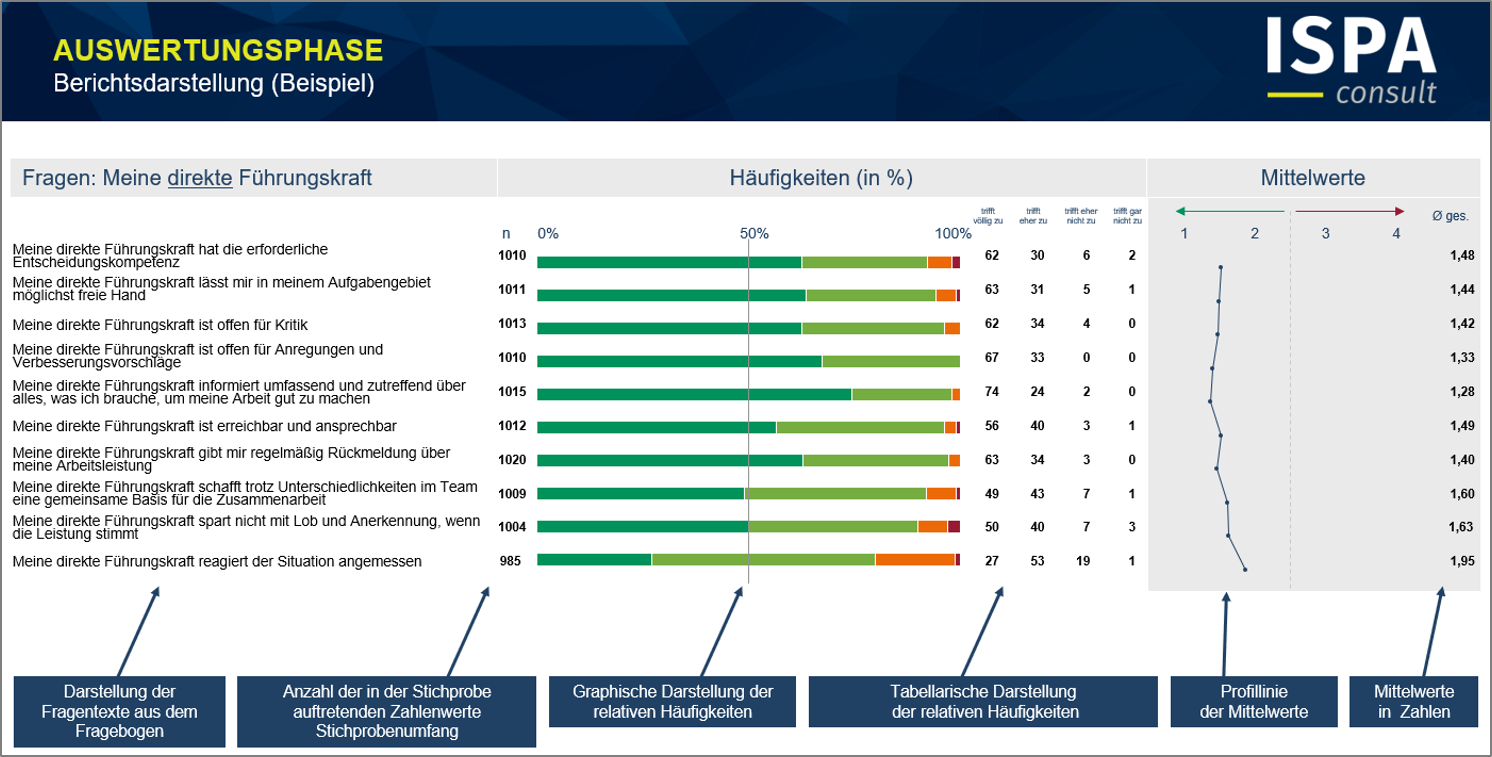
- Complete or detailed reports, graphically detailed, with frequency distributions and mean values for individual items. Overall reports are particularly suitable for the compact presentation of data at the group or company level. Detailed reports are used to present data to subordinate company or evaluation units (business / functional areas, regions, locations, departments).
- Statistical data tables (frequency distributions, means, medians, standard deviations, variances). These table bands are particularly useful for the overview of results according to statistical characteristics (gender, age).
- Special analyzes, such as Crosstabs or Mean Considerations. They provide a quick overview and comparison of the most important results.

Fig.: Extract from employee survey report
(3) Benchmark service
Within the overall or detailed reports there is the option of internal and external benchmark comparisons:
- With internal benchmarking, companies can, for example, compare their results with a previous survey through time comparisons or compare evaluation units with each other or with the calculated overall average value of the company through mean value comparisons.
- With external benchmarking, it is possible for the company to compare itself with sector-specific or non sector-specific average values.
ISPA consult GmbH offers the following types of external benchmarks:
- Industry-unspecific benchmarks from different industries.
- Industry-specific benchmarks from individual industries such as the metal and electrical industry, administration/cities, paper, publishing and printing industry (media).
(4) Open questions
ISPA consult GmbH offers the possibility of recording and evaluating "open questions".
In our experience, open questions are used by at least a third of respondents to report in more or less detail in their own words "what is on their minds" without being restricted by prefabricated questions and predetermined answer options.
We offer an effective and efficient evaluation of the open questions while preserving the anonymity of the respondents.
The results of "open questions" are presented graphically in a special report using "three-dimensional bar charts", "spin maps" and "word clouds".

Fig.: Three-dimensional bar chart

Fig.: Spinmap

Abb.: Wortwolke

